For the record this is a school project, and nothing is made for for the government at all. Everything is fictional and just an idea.
For school we had to make an expression for your own portfolio and the intention was therefore to make an expression / product that you would put on your portfolio website, here it is!. You had to make a product within your Specialization, in my case that was an app prototype/ui/ux design.
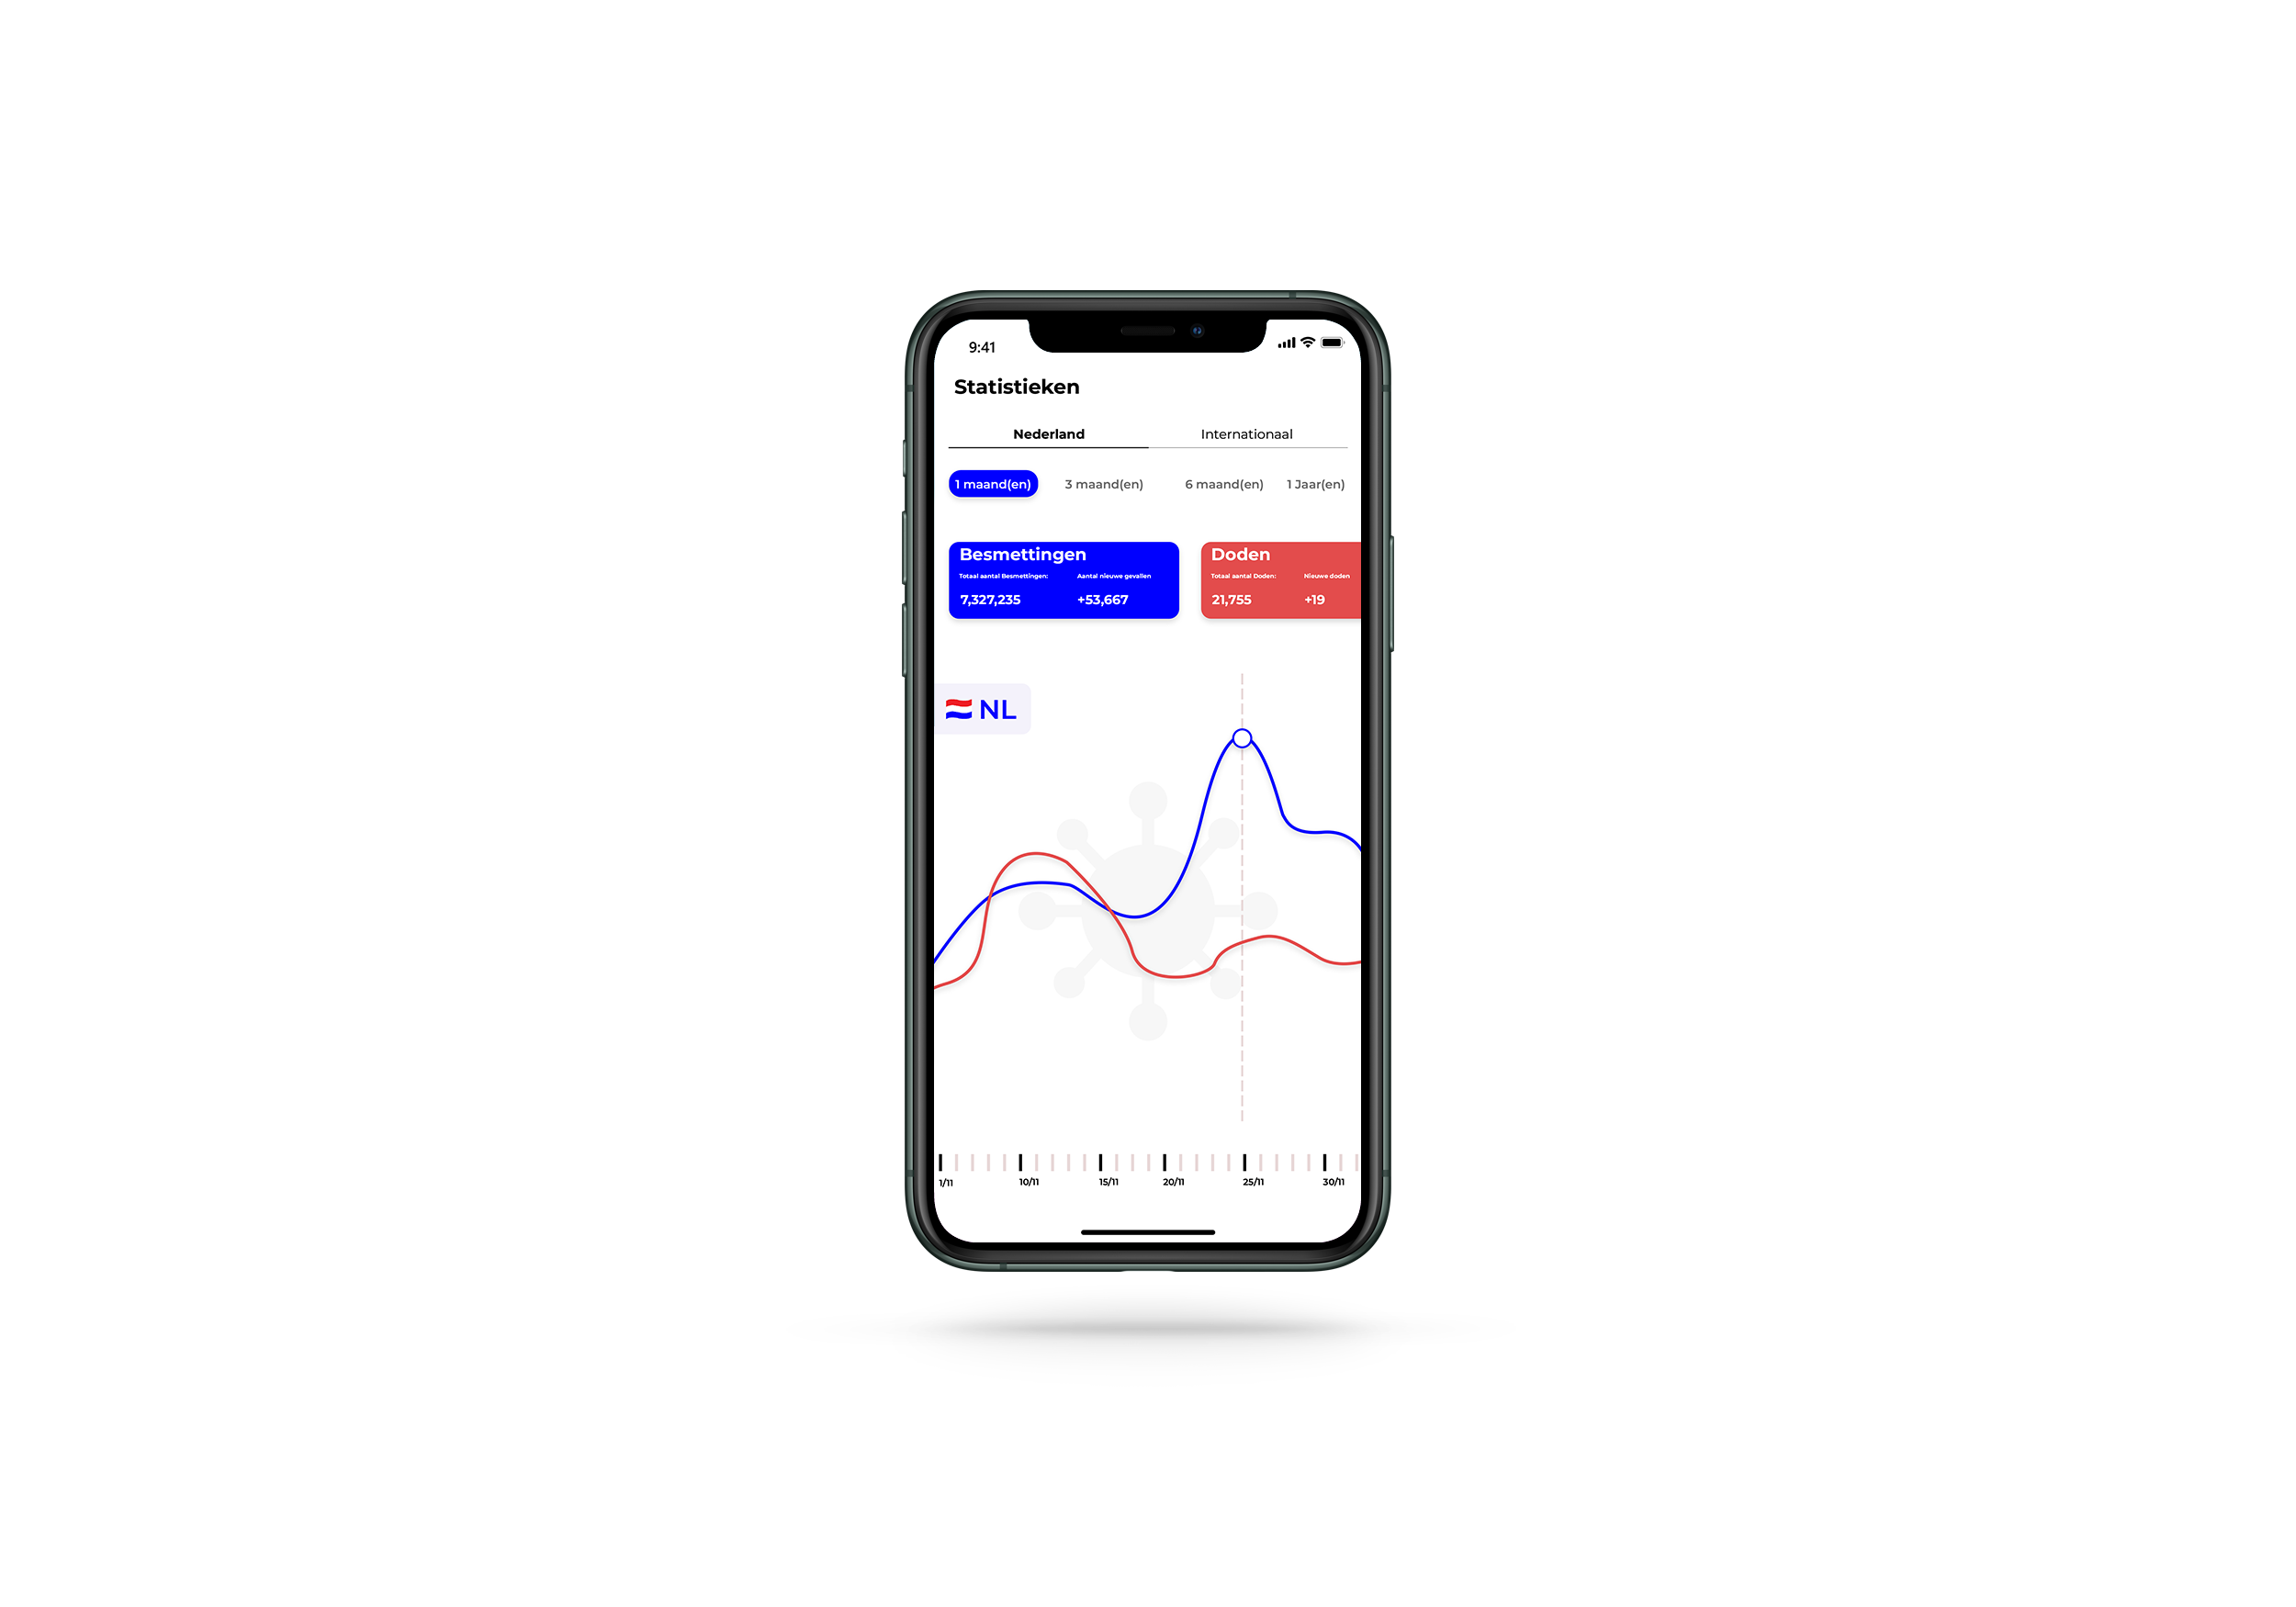
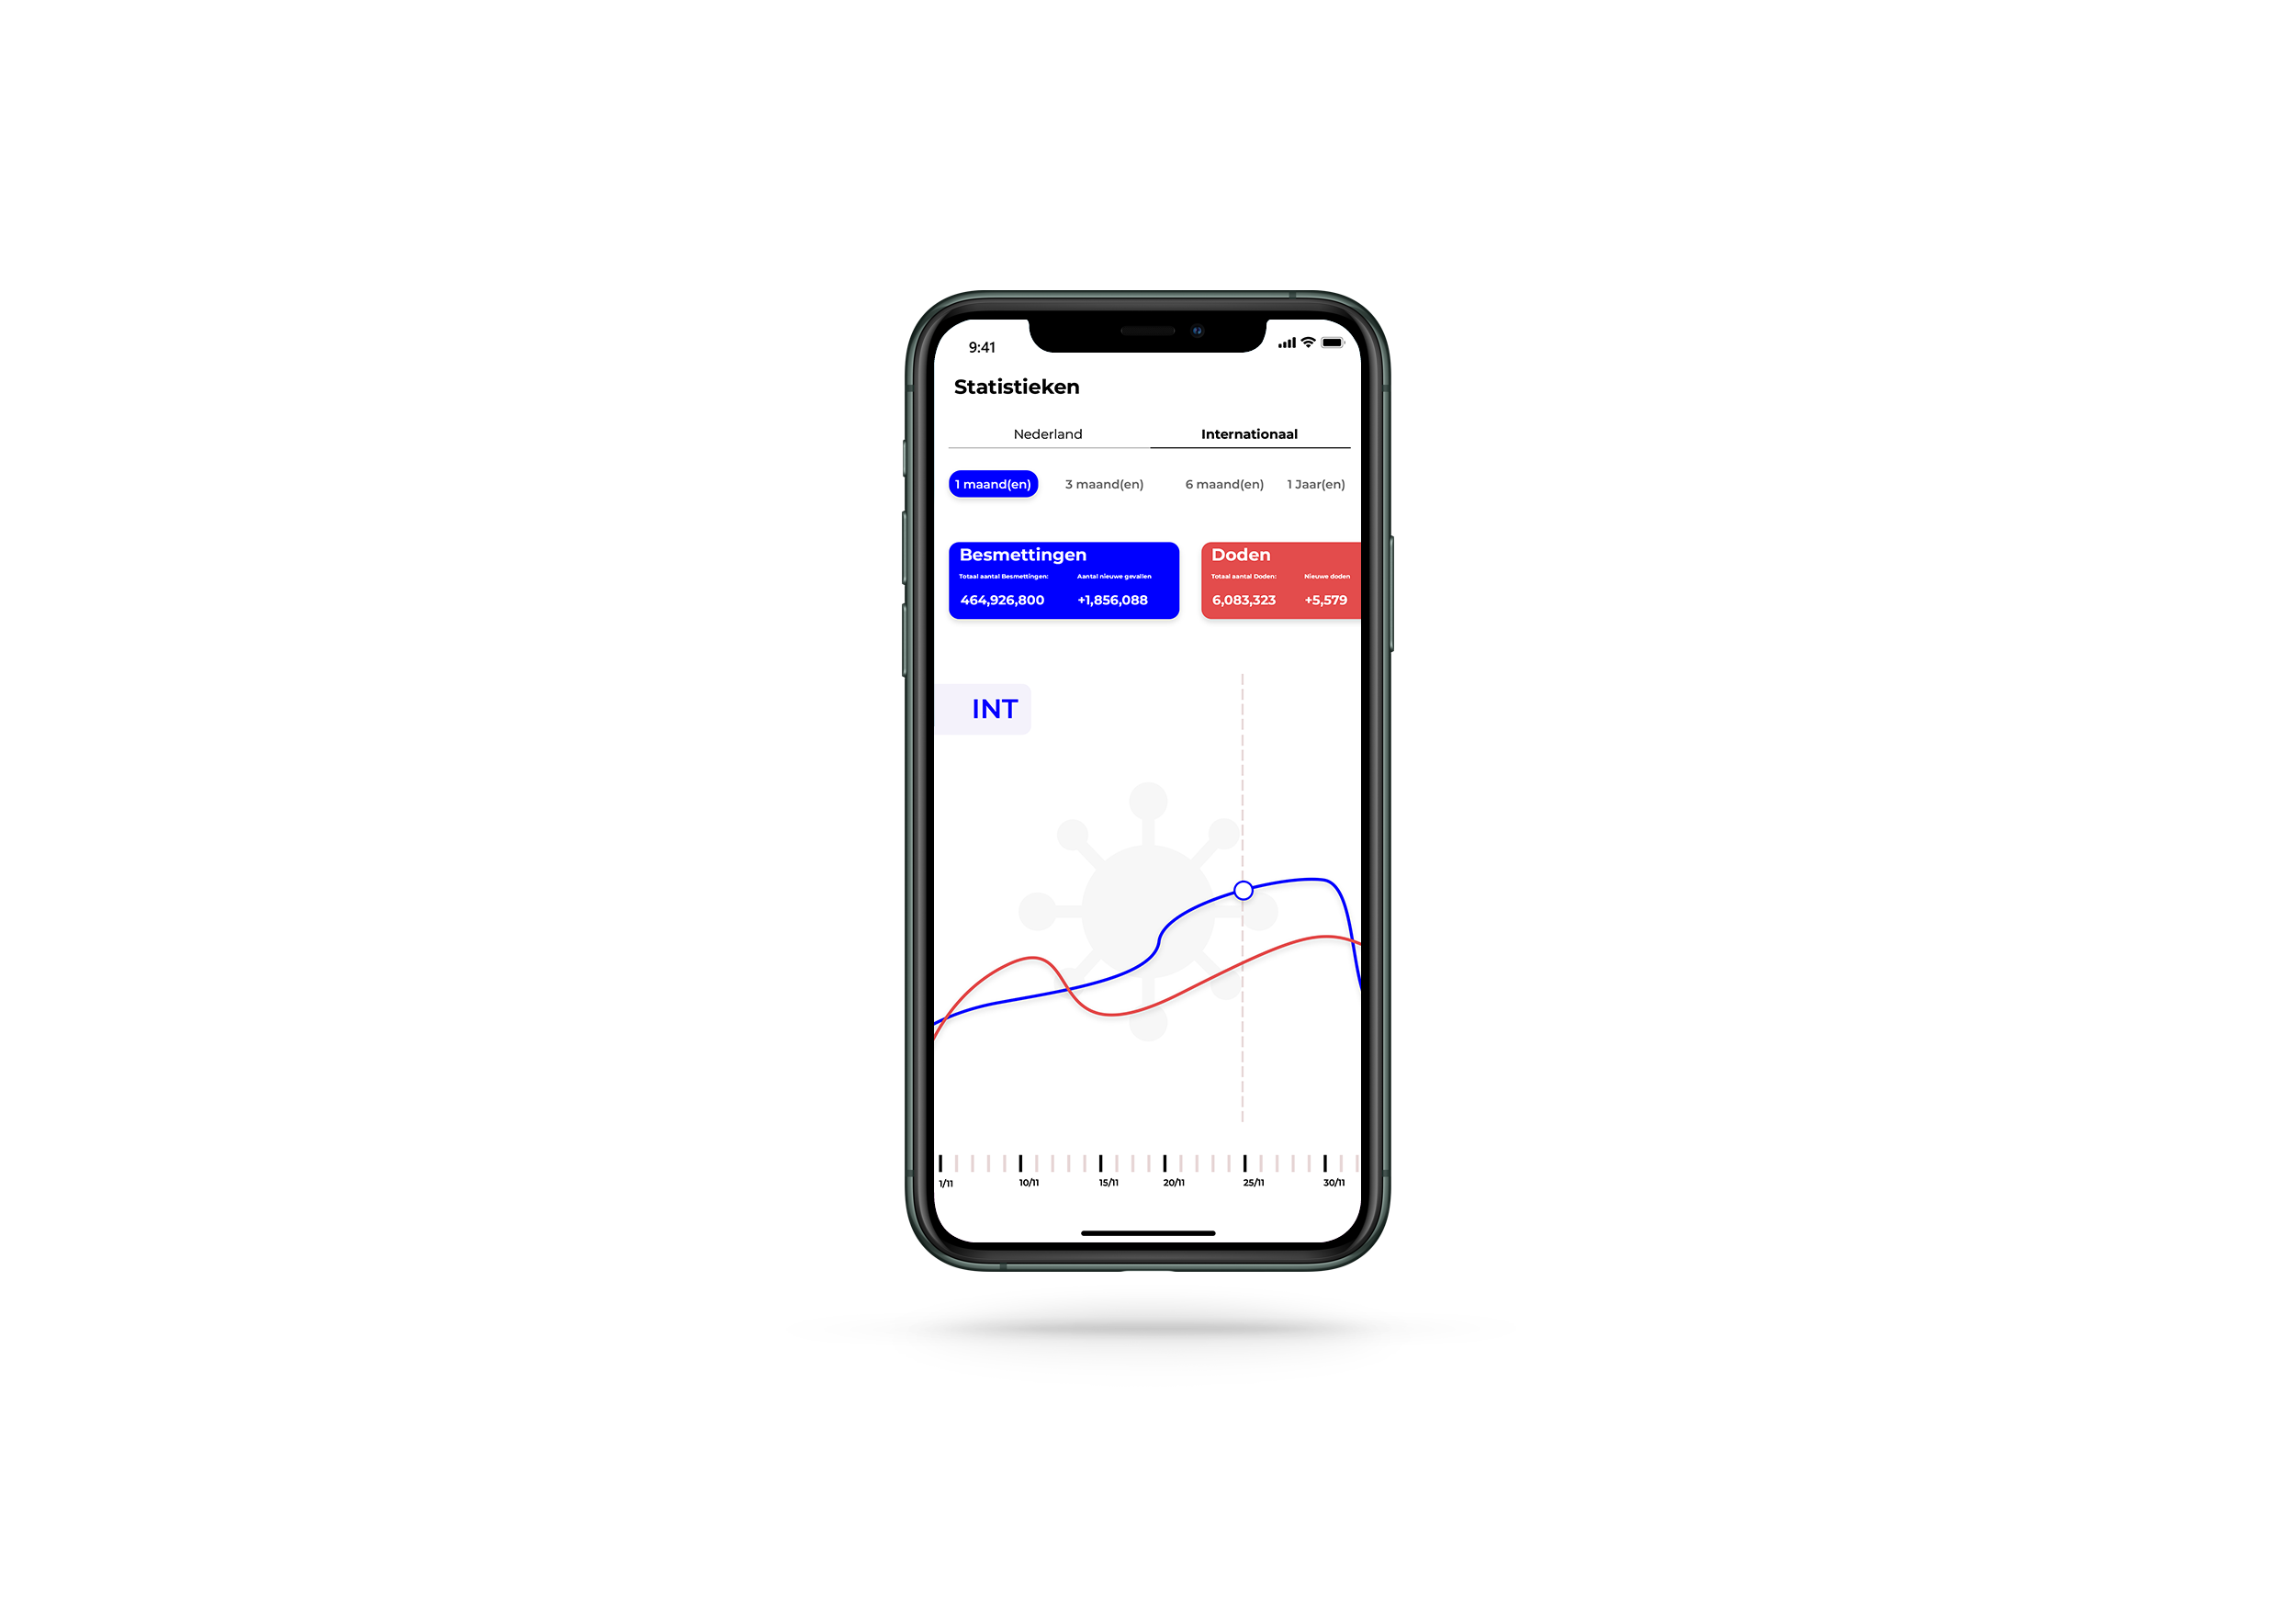
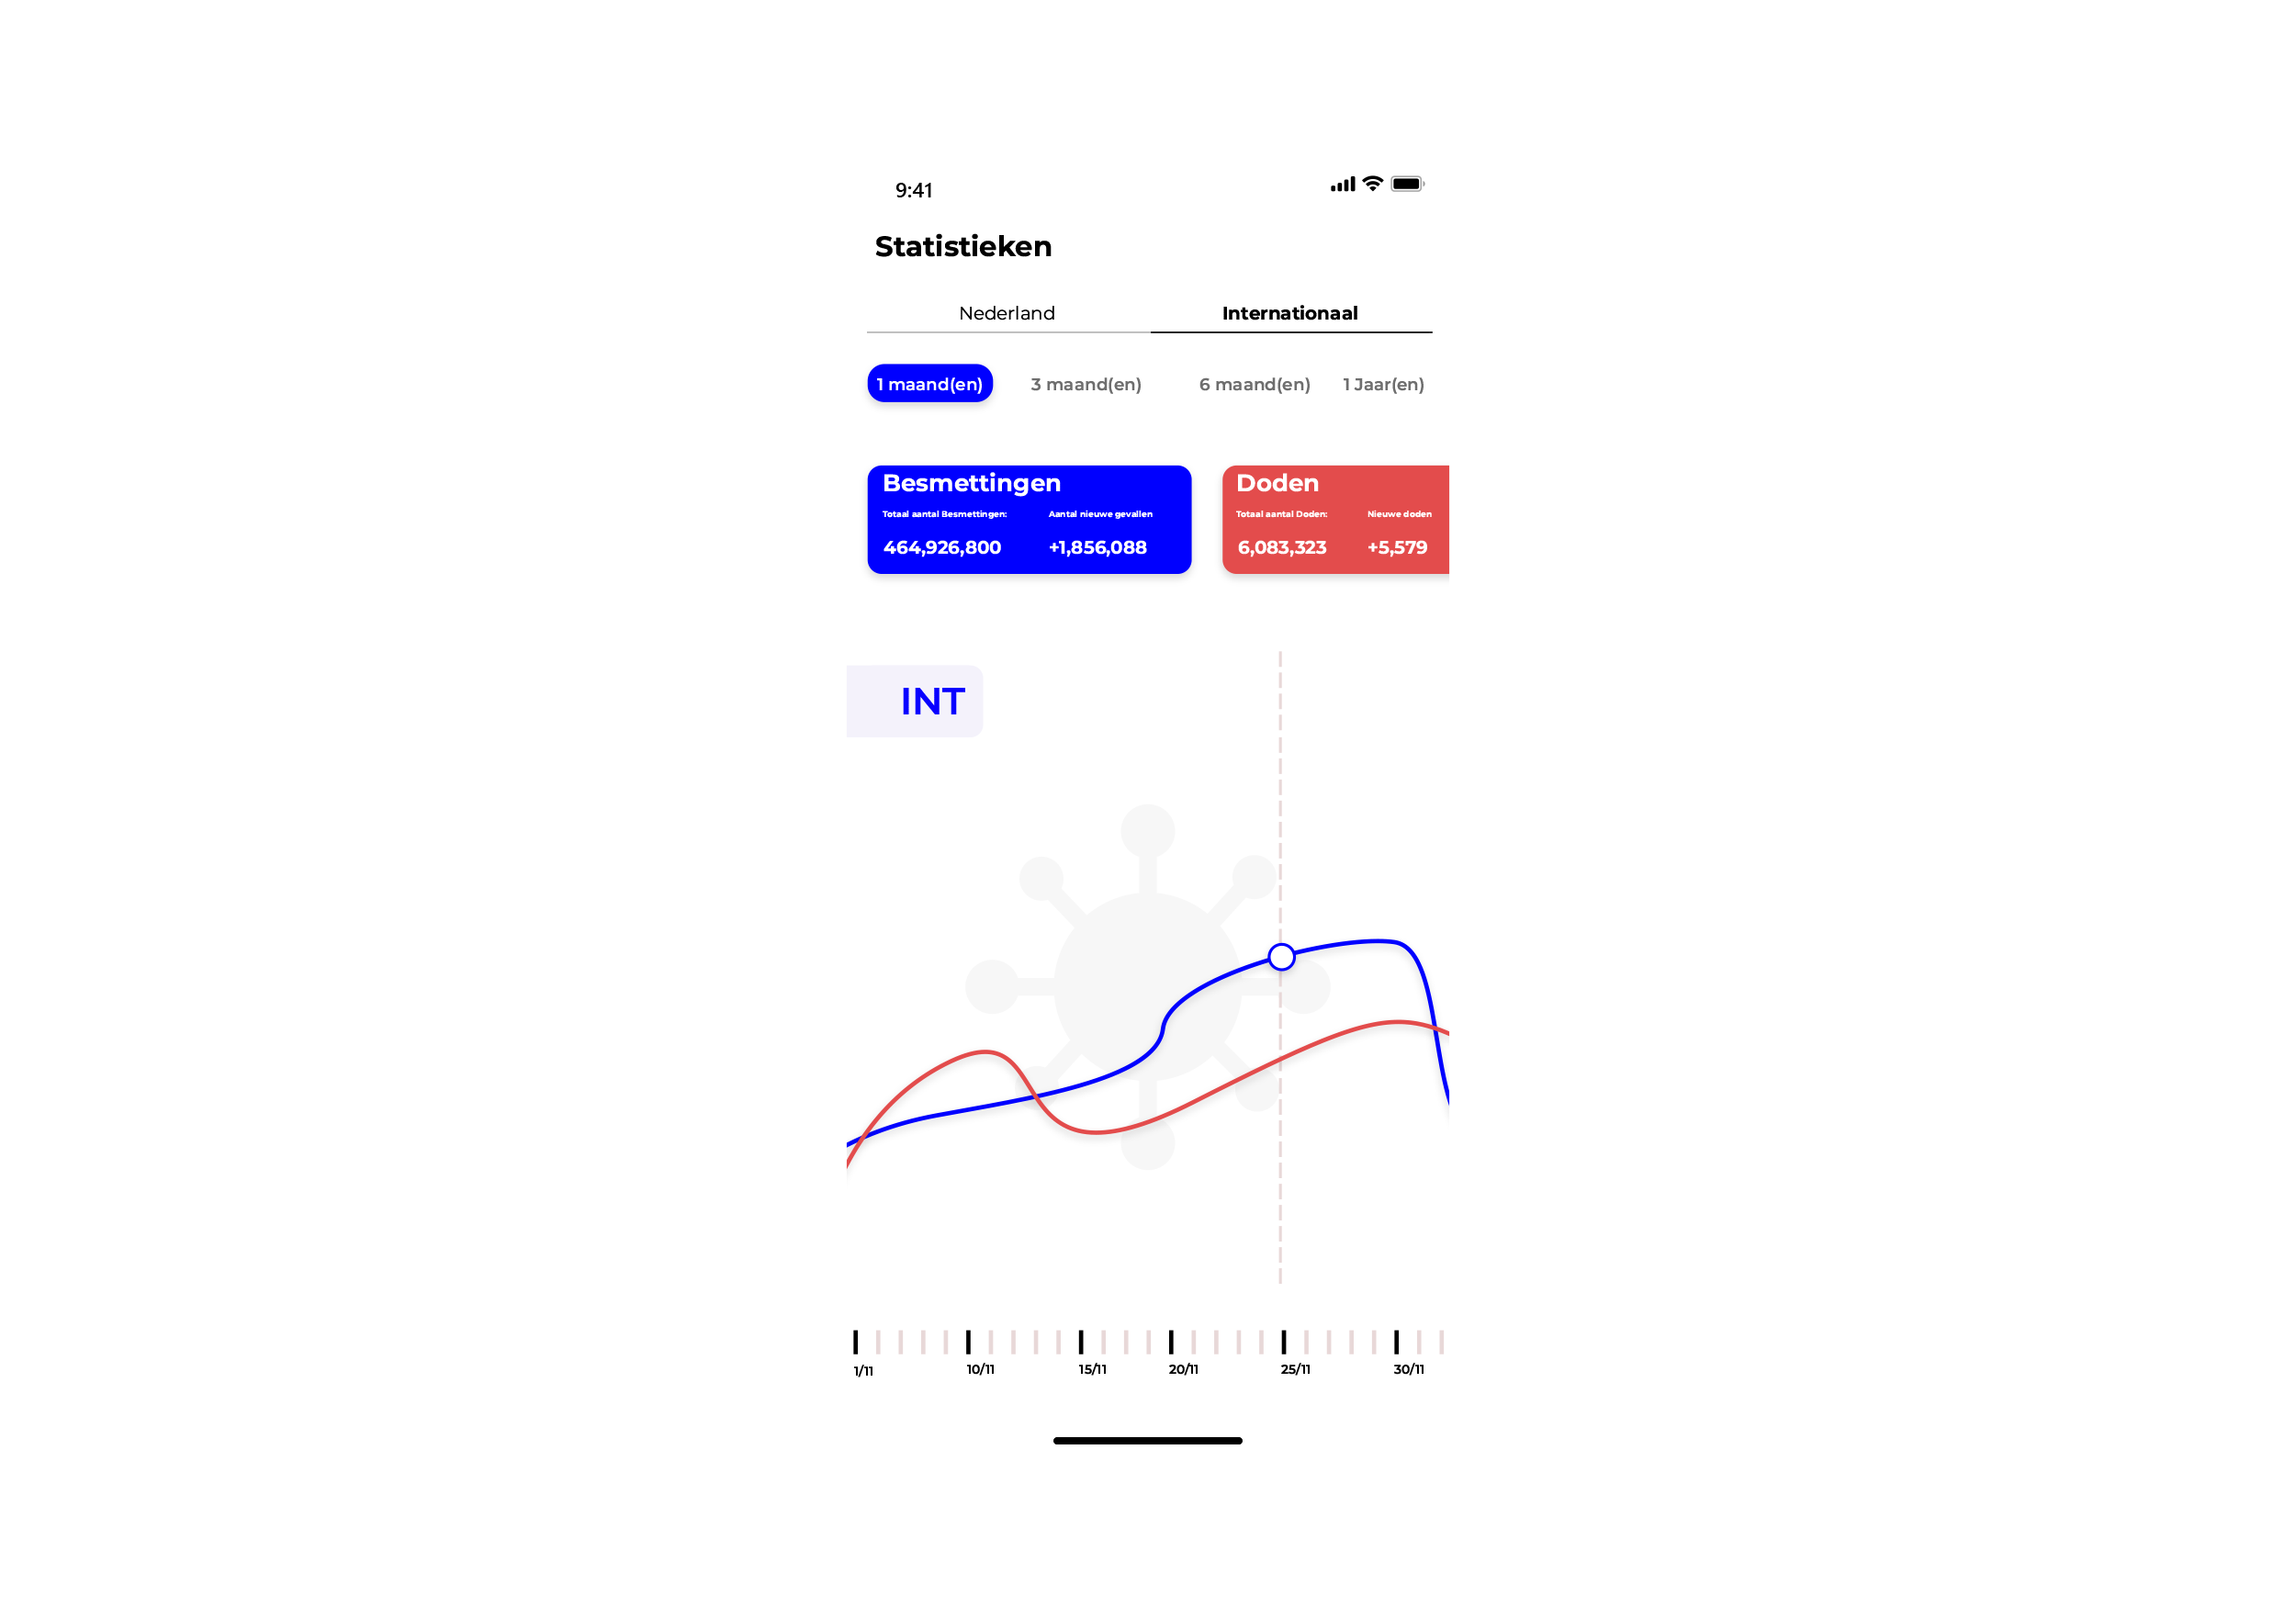
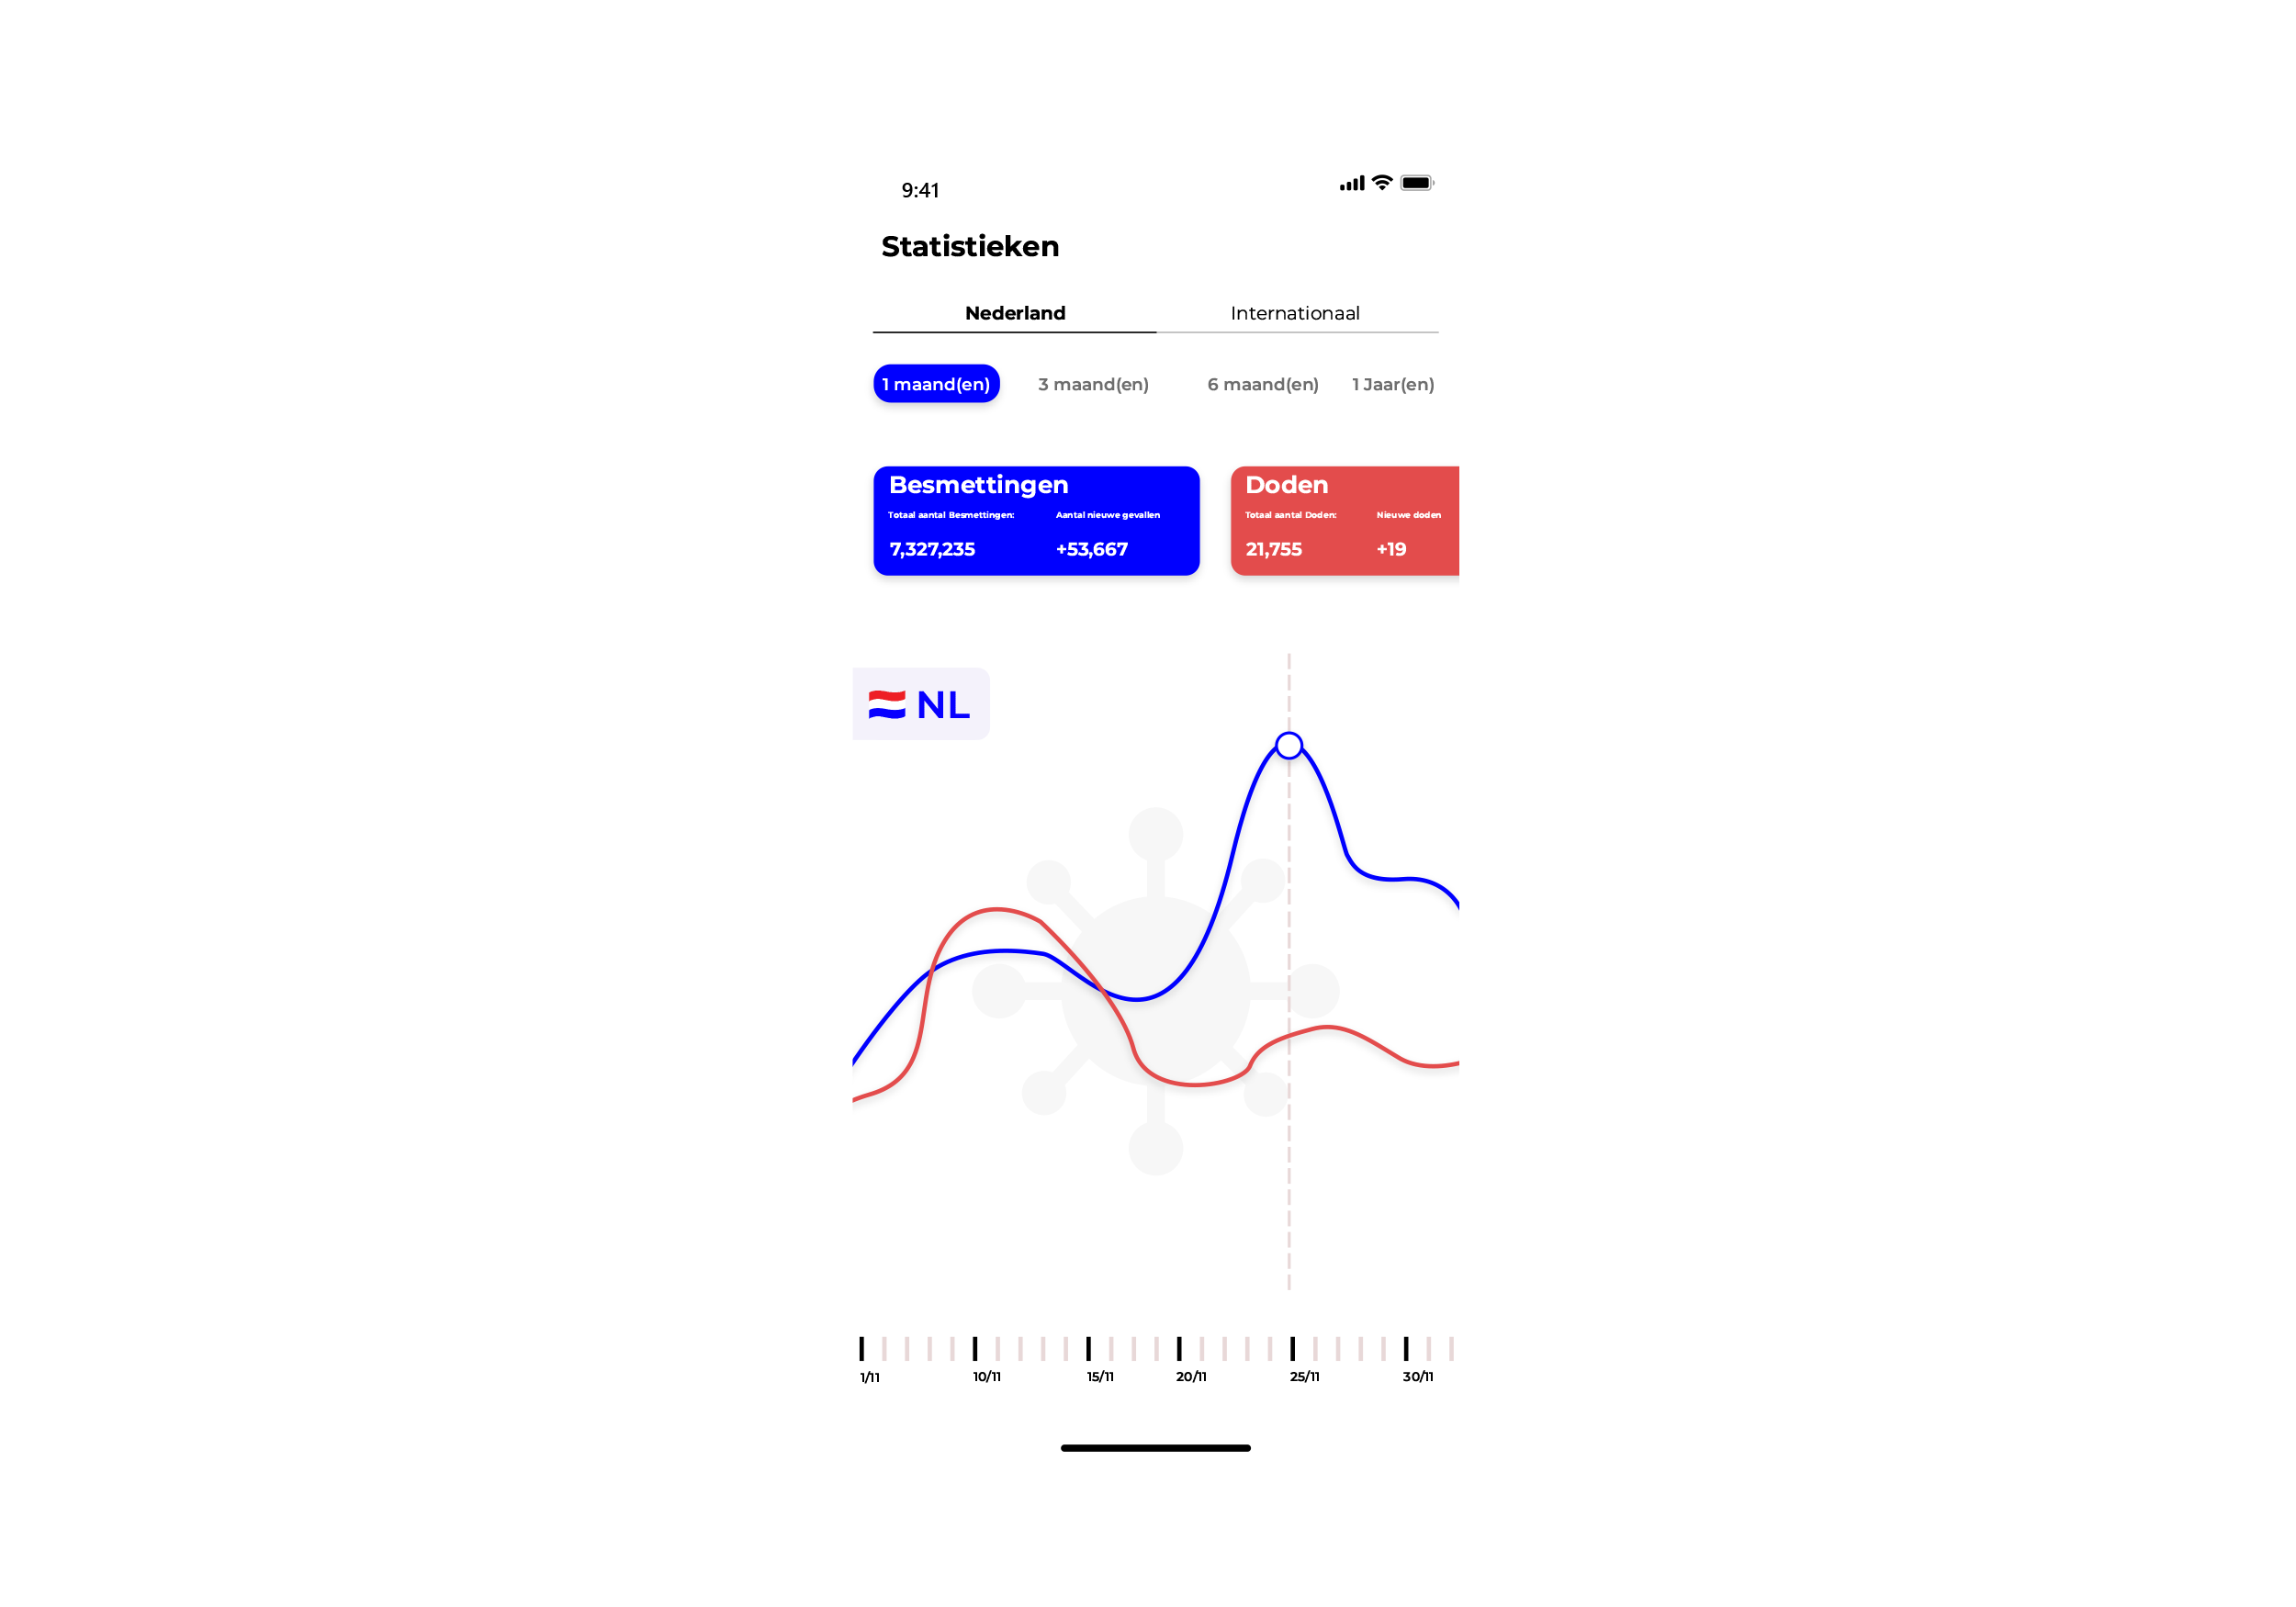
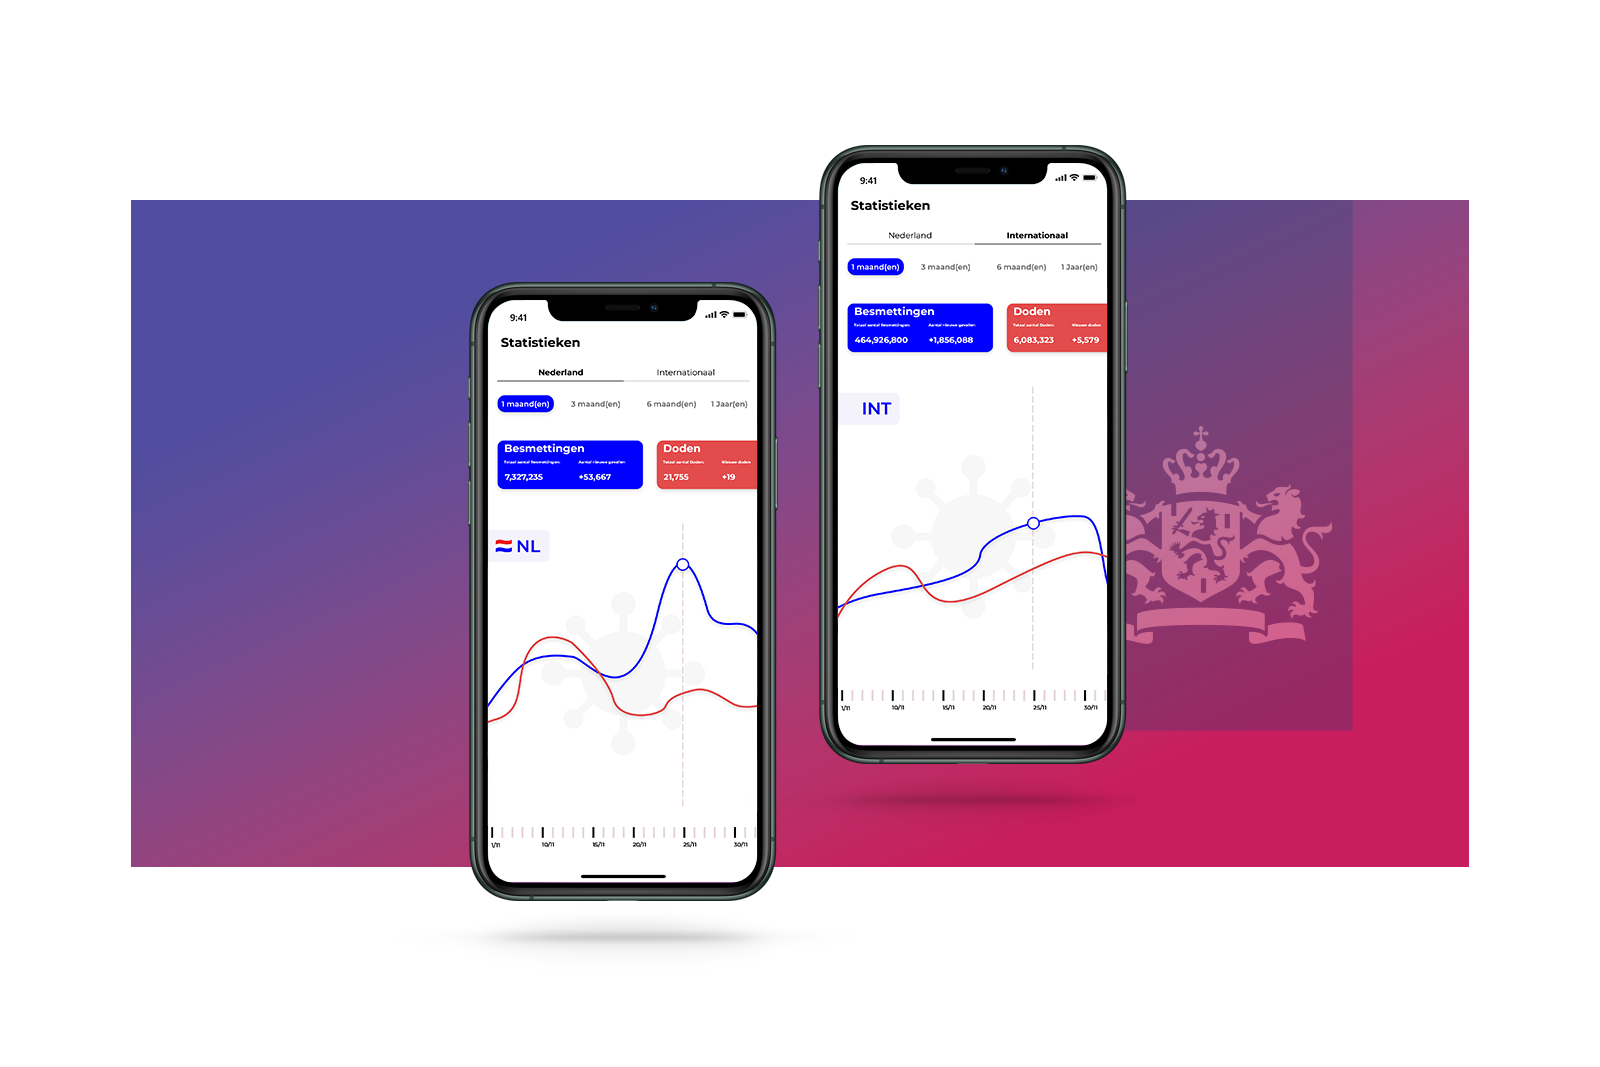
Ultimately, I chose to make an app that will supposedly display the live statistics of the number of corona infections in a live graph and counters.
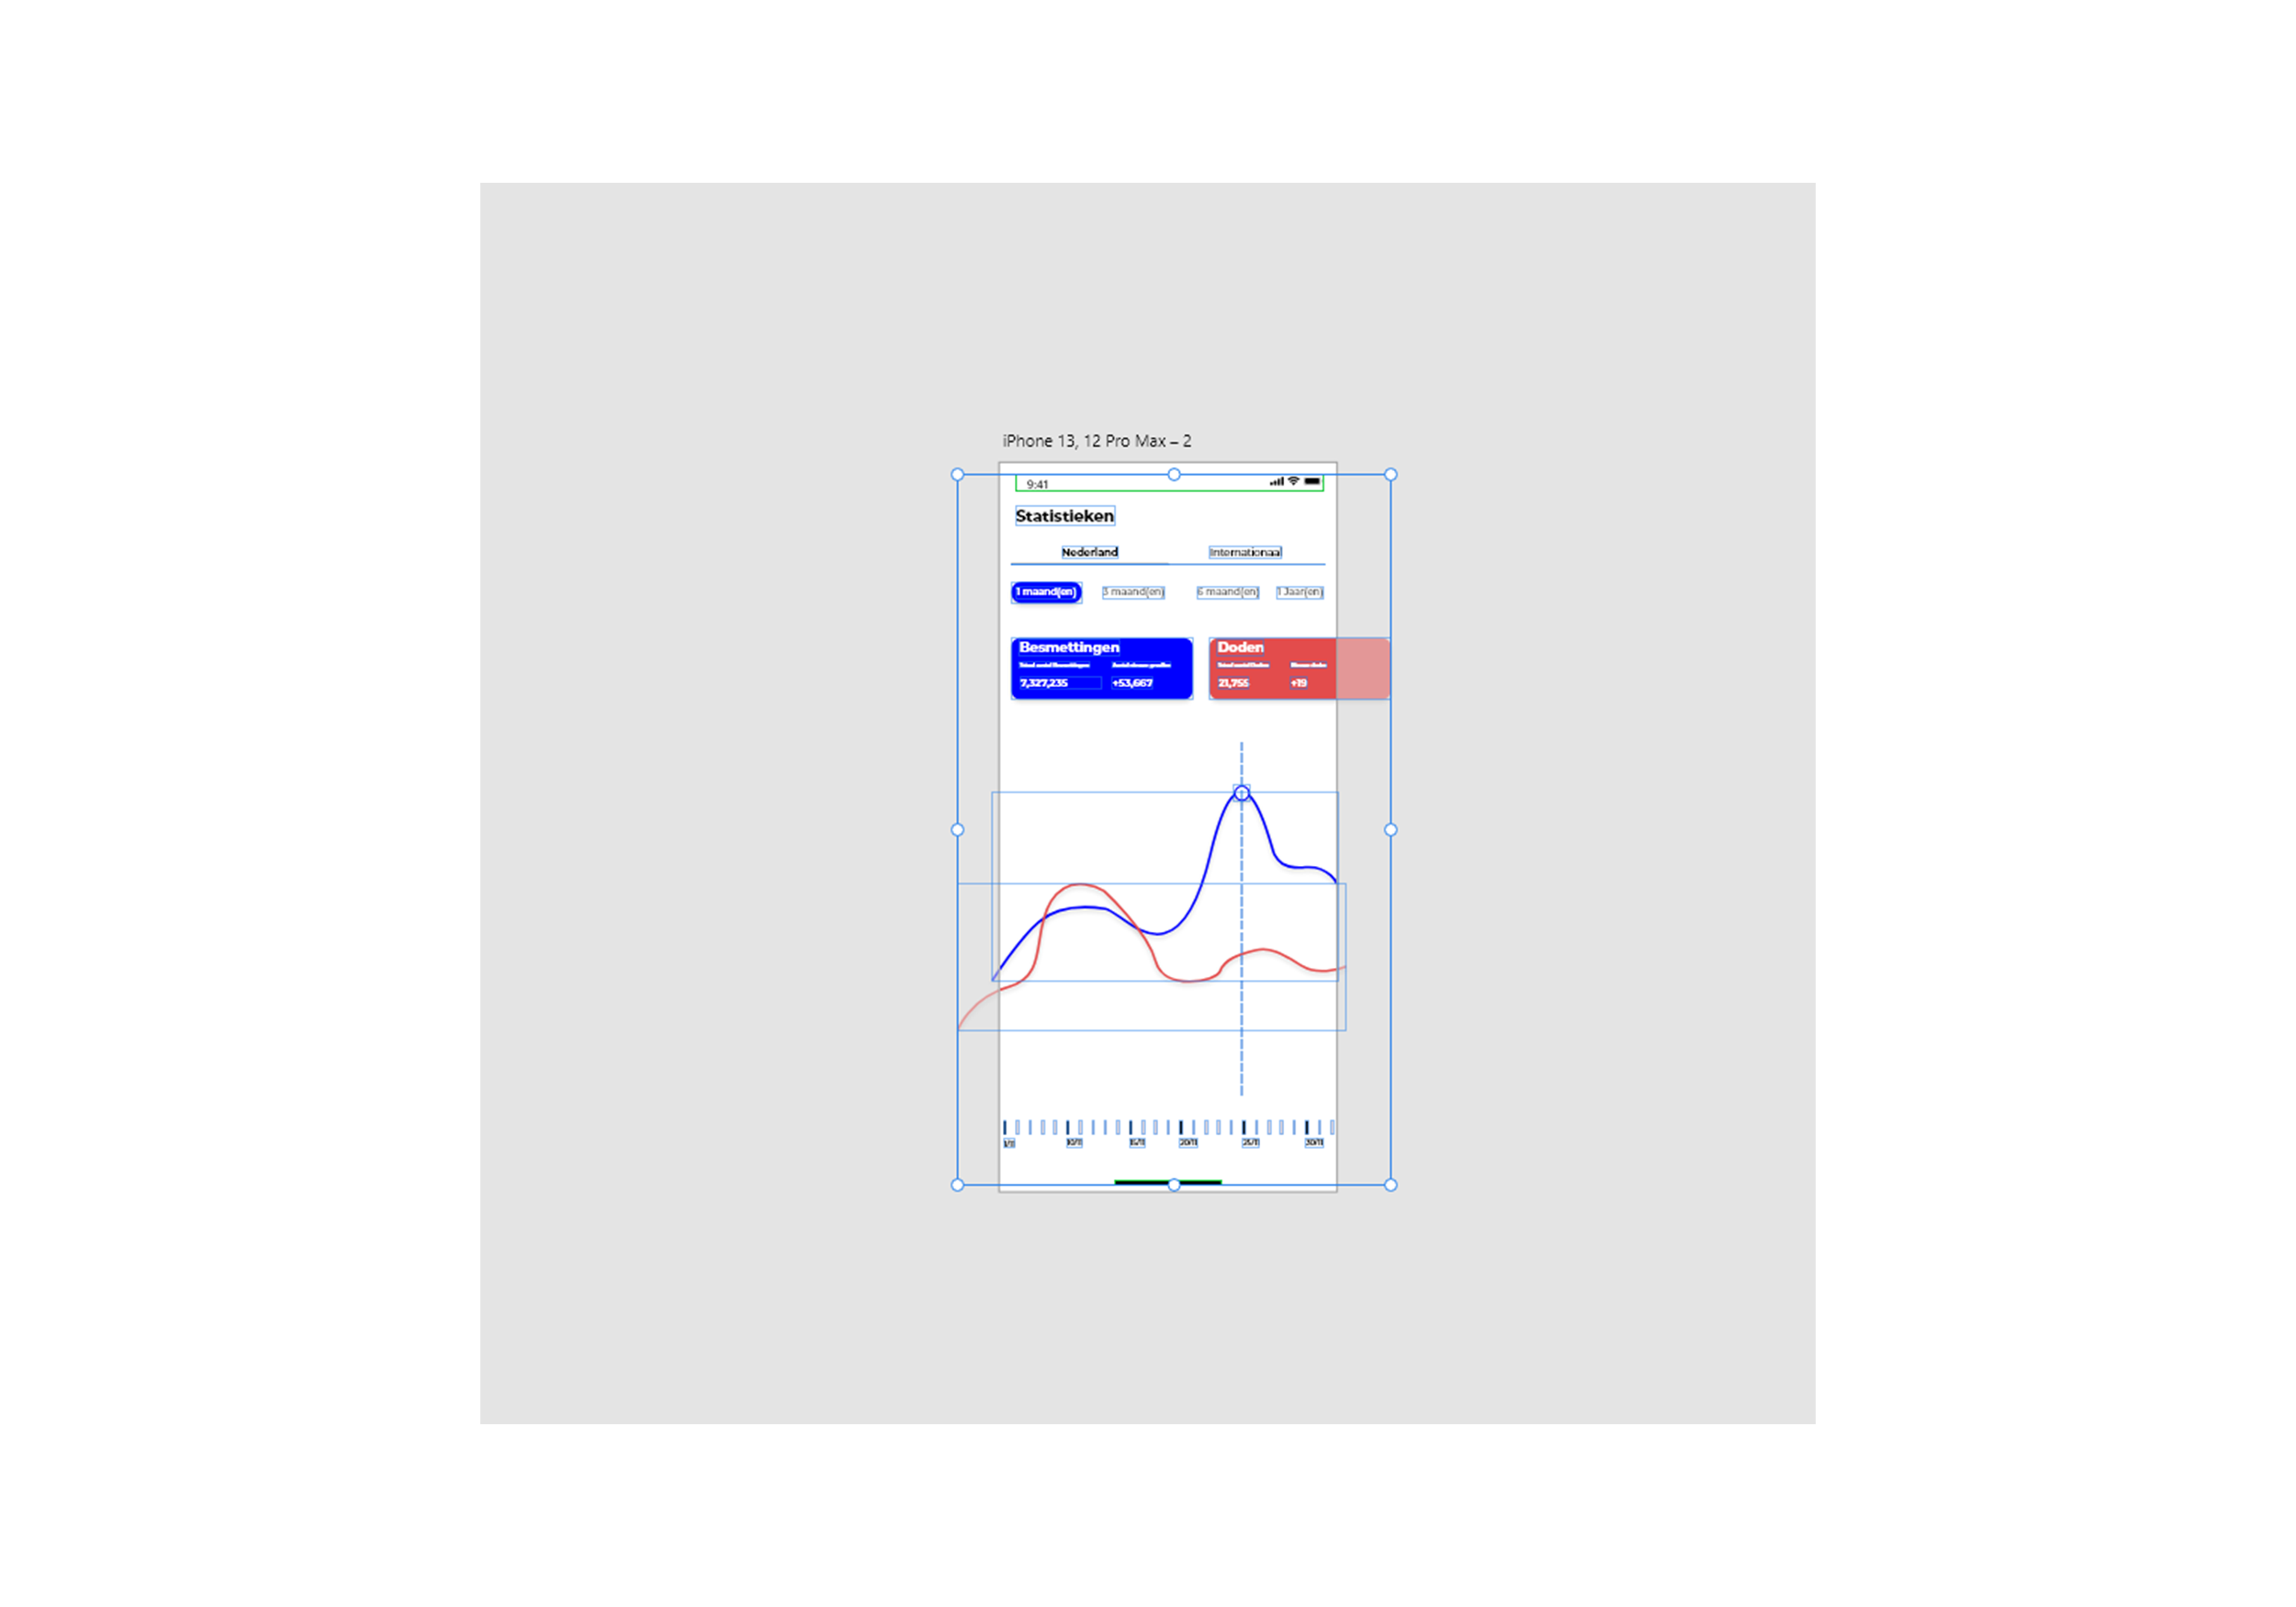
I went for a minimalistic app with few keys and bubbles and what was easy to use, as you can also see it is very easy to use, you can choose from the Dutch statistics andor the international statistics, right below that you have 2 blocks with the infections and deaths and below that a large and easily understandable graph to be able to see the infections in a graph .... (The lines and data do not all see correctly)
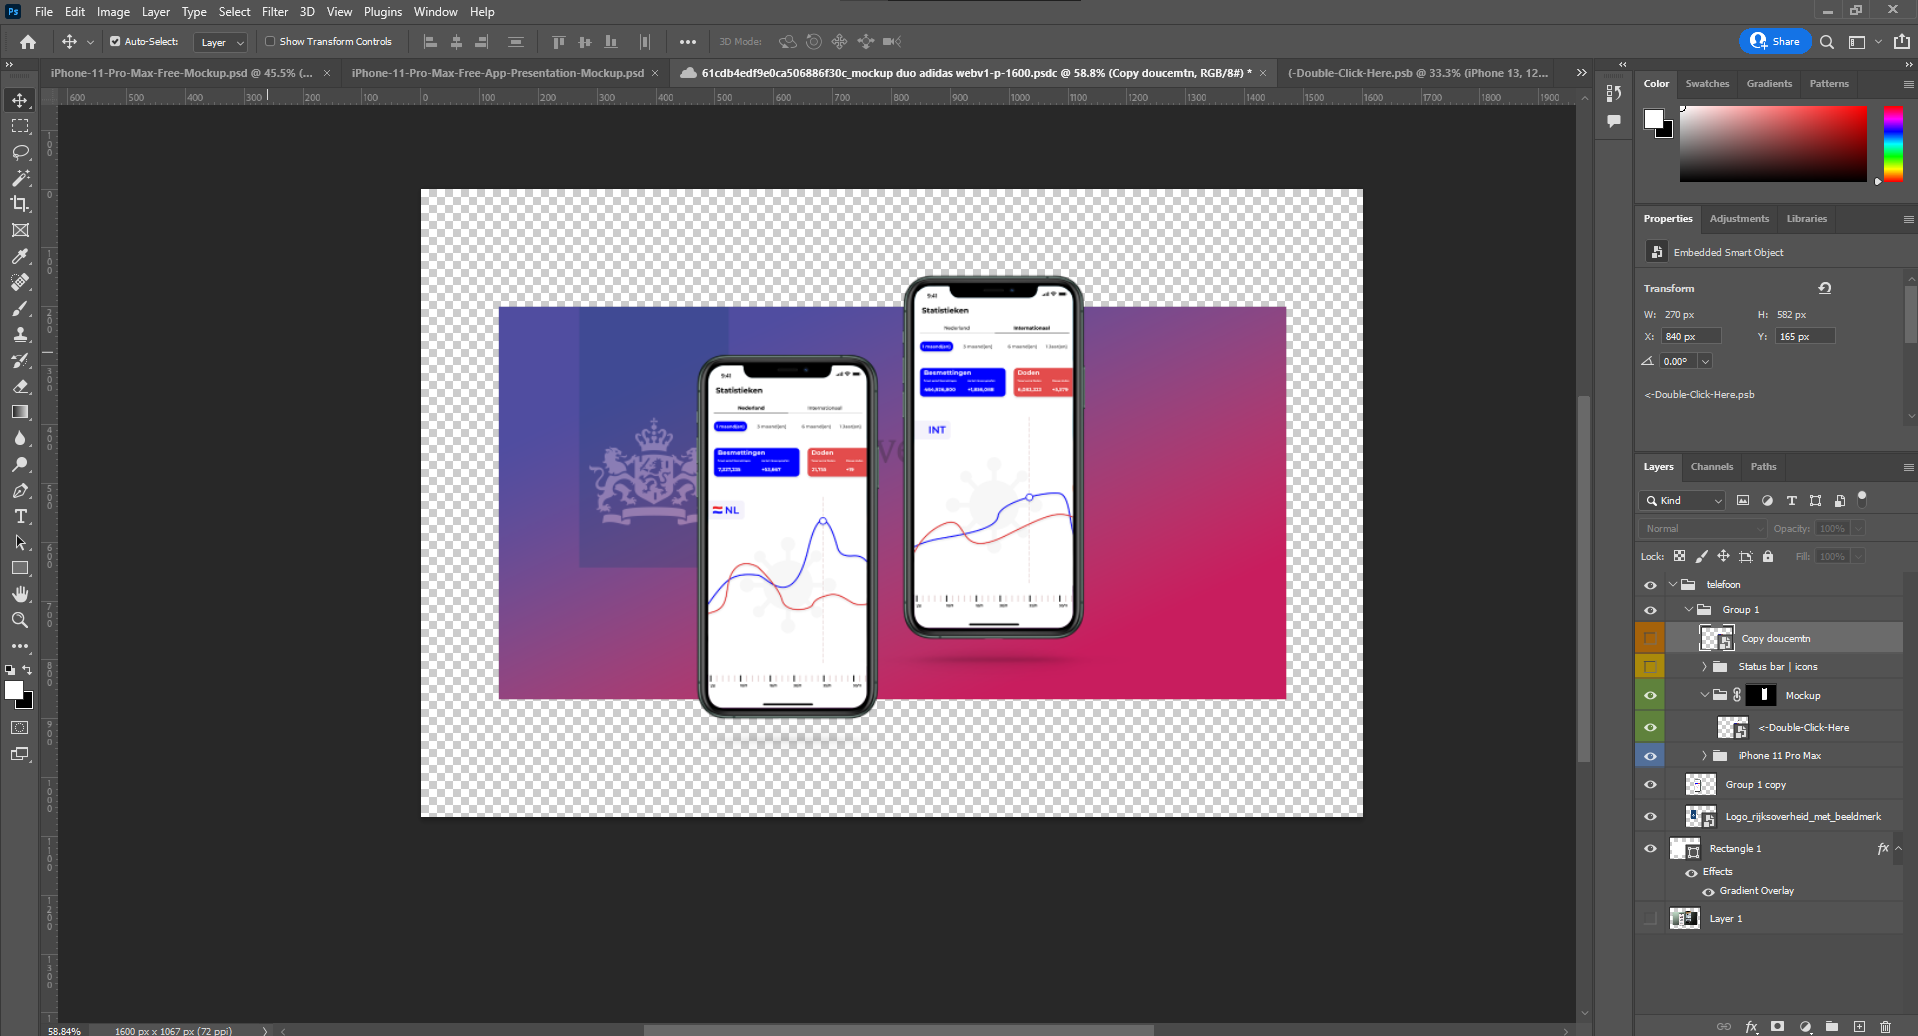
At the end of the gallery you can see some photos/screenshots of the design process to get an idea of how it was created and how I made the mockup, mood board etc etc.